- Click here for tutorials.
- Enhanced Statistical Reports Module RC Required
Overview
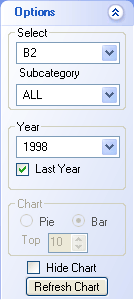
Select "RDP Ledgers" from the Navigation screen, main menu, or the
Navigation to open the RDP Ledger tab. Select
different ledgers, categorize by transaction code, display for past years, and
select different types of charts.
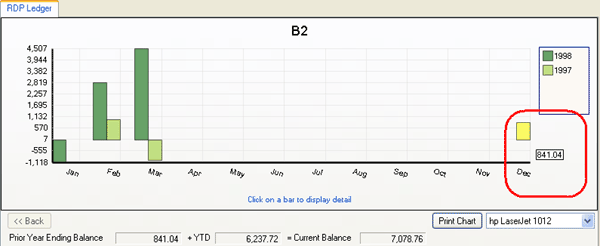
As shown in Figure 1 below in
the red encircled area, hover over a
bar to view the total amount represented. The color of the bar is changed
temporarily to help signify to which bar the total applies. The chart
displayed has drill-down capabilities. Click any bar within
the chart to open another chart specific for that selected bar. 
Figure 1
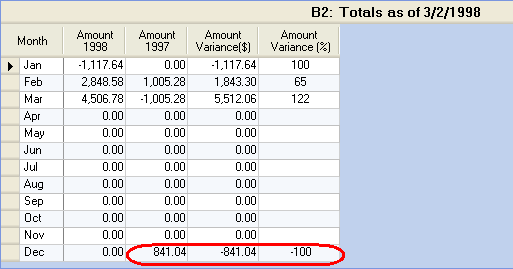
The grid below the chart displays the Grand Totals data based on the Options
selected. Details available
for each month are Amount
(Year), Amount (Year to compare with), Amount Variance ($), and Amount
Variance (%). Totals are displayed at the bottom of the grid.
Double-click any Month row to drill-down and view that month's detail by day and
display a chart for any selected day within that month. To return to the
monthly chart, click the "<< Back" button.
Figure 2
Options
Click these links for Frequently Asked Questions or Troubleshooting assistance.
05/11/2010
© 1983-2009 Resort Data Processing, Inc. All rights reserved.
